The Stochastic Combo trading strategy is based on the stock price satisfying a
combination of conditions of the various technical indicators. For the buy signal,
the stock will have to show a long-term up trend, the momentum indicators will
have to indicate that the stock is oversold, the RSI will have to be low, and the
price will have to be near the lower Bollinger Band, showing starting signs of
bounce-back. The figure shows such an example:

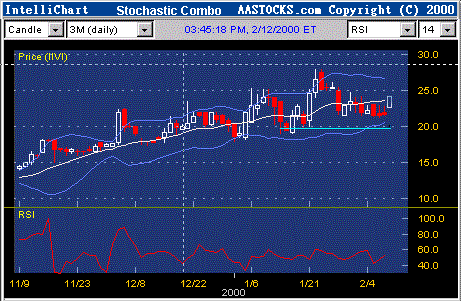
Figure 24(a). This is a buy signal from our Stochastic Combo model. The
stock is in an up trend and all the indicators (RSI, K/D, MACD and
Bollinger Band) show that the stock is oversold. Furthermore, the stock at
present has already turned up.
For the sell signal, the stock will have to show a long-term down trend.
Momentum indicators will have to signal that the stock is overbought, that the
RSI is high, that the MACD is favorable, and that the price is close to the upper
Bollinger Band, showing first signs of decline. All this is illustrated in the figure
below:

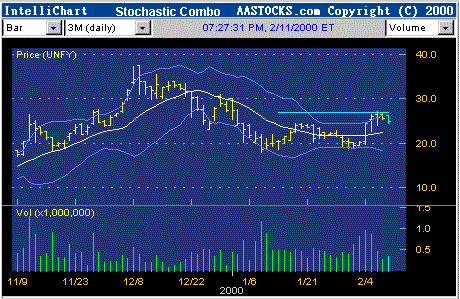
Figure 24(b). This is a sell signal from our Stochastic
Combo model.
The trading strategy is to ride on a general trend and at the same time enhance
profits by capturing the likely short-term mean reversion. If the stock moves as
expected, one should hold until the price penetrates the center Bollinger Band (a
14-to-20-day moving average), or even until the price nears the opposite Bollinger
Band. If, however, the price moves in the wrong direction, one should cut losses
shortly after it goes beyond the prior day’s intra-day extreme.
