Members | Market | Warrants | Research | A.I. | Education | AASTOCKS | Products | US Stocks
Back to Home  
Member Service| Live Picks| Top Features| Back Test| Market| Tech Analysis| University| About Tradetrek
Content | AASTOCKS glossary
Stock ID: Quote Chart News Fundamentals Comment 5-day Forecast 6-month Target
Introduction to Online Trading

Stock Charts
Line Chart
Bar Chart
Candle Sticks
Reference Chart

Technical Indicators
Moving Average
Bollinger Band
RSI
K/D
MACD

Technical Trading Strategy
Moving Average Crosses
Candle Stick Trend Reversal
Head and Shoulder
Range Breakout
Triangle Breakout
Cup-With-A-Handle
Triple Top/Bottom
Stochastic Combo

Market Neutral Strategy
Why does the strategy work?
Historical Test
Convergence Pairtrade
Divergence Pairtrade

Artificial Intelligence Applied to Stock Trading
Live Technical Stock Search
Live Stock Comments
Neural Network Forecast
Fundamental Analysis

Risk Management
Performance Benchmark
Value At Risk (VAR)
Hedging
Singe Trade Risk Management
Portfolio Risk Management

Trading Screens on the Internet

Execution Skill
Trader’s Torment: Bid/Ask Spread
Demand and Supply at a Glance: Bid/Ask Sizes
Limit, Market and Stop Orders
1/16 Makes All the Difference

Trading and Investing

How to Be a Successful Investor

Glossary

   
back Back Next next

Technical Trading Strategies

Technical analysts and traders believe that certain stock chart patterns and shapes are signals for profitable trading opportunities. Many professional and amateur traders claim that they consistently make trading profits by following those signals. In this chapter we introduce eight types of stock patterns and the corresponding trading strategies, that, according to our extensive historical tests, give the trader an advantage.

"Cup-With-A-Handle"

According to AASTOCKS's extensive and rigorous historical tests, the Cup-With-A-Handle breakup pattern is the most reliable technical buy signal. The figure below shows a typical example:

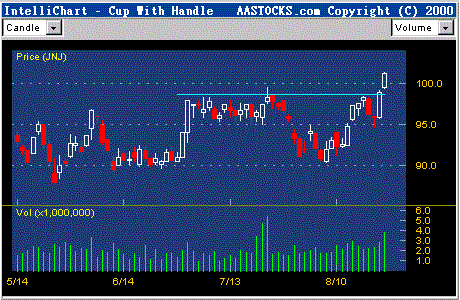
Figure 20. This is the typical Cup-With-A-Handle breakup pattern, a strong buy signal. According to statistics, stock prices rise 70% of the time after such a breakup.

The strategy is to buy the stock as the price breaks up with larger than average volume, then cut losses if it drops back to the pre-breakup level. If it goes up as expected, this pattern calls for successively raising the stop levels, giving the trade a chance to capture most of the up potential. According to AASTOCKS's extensive experience and historical testing, the opposite pattern of the Cup-With-A-Handle does not work nearly as well.

back Back Next next
 

Disclaimers | Privacy Policy | Career Opportunities | Contact Us | Help
www.aastocks.com
Support Hotline:(852)2186 8685/ (852) 2121 8803
Email: support@aastocks.com
Copyright 2000 AASTOCKS.com Ltd. All rights reserved.
AASTOCKS.com LIMITED is a SFC registered Investment Advisor.
Note: AASTOCKS.com Ltd endeavors to ensure the accuracy and reliability of the information provided but does not guarantee its accuracy or reliability and accepts no liability (whether in tort or contract or otherwise) for any loss or damage arising from any inaccuracies or omissions.