|
Technical Trading Strategies
Technical analysts and traders believe that certain
stock chart patterns and shapes are signals for profitable trading opportunities. Many
professional and amateur traders claim that they consistently make trading profits by
following those signals. In this chapter we introduce eight types of stock patterns and
the corresponding trading strategies, that, according to our extensive historical tests, give the trader an advantage.
Range Breakout
The figure below shows an example of a typical Range Breakout pattern.
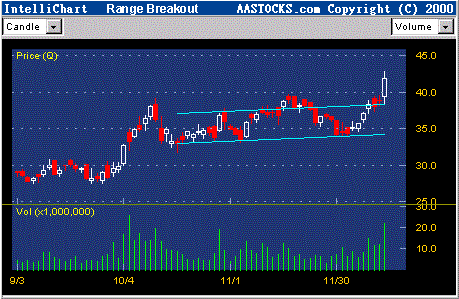
Figure 16. A typical Range Breakout
pattern, a strong buy signal. Note that the stock price breaks out of the trading range
defined by the two range lines with large volume.
The trading strategy for a Range Breakdown is just the opposite that of Head and-
Shoulders:it indicates a strategy of selling as the stock breaks the lower range line
with larger-than-average volume, and continuing to hold until the stock has fallen a
distance comparable to the height of the range. If the price goes up instead, one should
stop losses as it penetrates the lower range line.
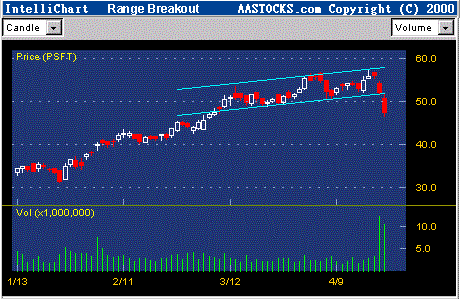
Figure 17. This is a typical Range
Breakdown with large volume, a strong sell signal.
The trading strategy for a Range Breakdown is just the opposite: sell as the stock breaks the lower range line with larger than average volume, and continue to hold until the stock has fallen a distance comparable to the height of the range. If the price goes up instead, one should stop loss as it penetrates the lower range line.
|