|
Technical Trading Strategies
Technical analysts and traders believe that certain stock chart patterns and shapes
provide signals of profitable trading opportunities. Many professional and amateur
traders claim that they consistently make trading profits by following such signals.
In this section, we introduce eight types of stock patterns and the corresponding
trading strategies that, according to our extensive historical tests, give the investor
a strategic trading advantage.
Moving Average Crosses
The evolution of stock prices over time can be seen as a shorter-term, random
oscillation, on top of a longer-term trend. Most stocks show a rather "rhythmic"
short-term oscillation with a typical cycle of about 14 to 25 days. If we believe
that such a cycle does exist, we should bet that the stock price will continue to
go through the moving average line after it is crossed, as seen in the following:
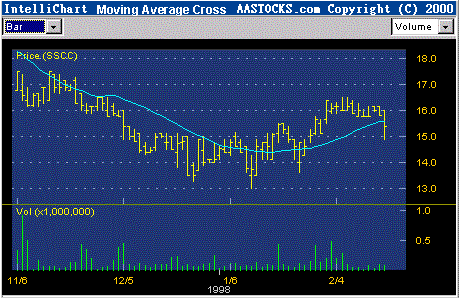
Figure 9. The stock crosses down through its 20-Day Moving Average with
a large momentum. A likely down pattern.
For a stock in an obvious long-term trend, the 50-day moving average line usually
damps out most of the shorter-term oscillations; therefore, this can be used as a
reliable "moving support line." A good trading strategy is to buy the stock if it is
in an up trend and if the price bounces back up after it touches or lightly penetrates
the 50-day moving average. The following figure presents such an example:
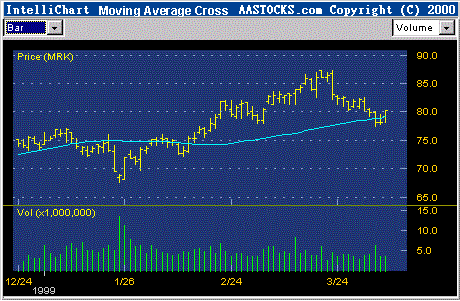
Figure 10. The 50-day Moving Average is often used as a moving support
line for stocks in an up trend. Technical traders think that it is a strong buy
signal if the stock price bounces back after reaching the support line.
The corresponding opposite trading strategy is to
"short"
the stock if it is in a down trend and if the prices drops back down after it touches
or lightly penetrates the 50-day moving average.
|